Hey everyone, today I want to talk about my little adventure with weather soundings. I’ve always been kind of fascinated by weather, you know, how it all works up there. So, I decided to dive in and see what these soundings are all about.
First off, I started by doing some digging around to figure out what a weather sounding even is. Turns out, it’s basically a way to measure different parts of the atmosphere using a thing called a radiosonde, which is attached to a weather balloon. Cool, right? These little gadgets collect data like temperature, humidity, wind speed, and direction as they go up.
I got my hands on a dataset from a weather station nearby. These files were full of numbers, and honestly, it was a bit overwhelming at first. It was time to get organized.
Getting Data Organized
- Downloaded the Data: I snagged a bunch of sounding data files. It’s just a plain text file, easy peasy.
- Checked the Format: Made sure I understood how the data was laid out. Each line had different measurements at different heights.
Next up, I needed to actually read this data into something I could work with. I used Python for this because, well, it’s pretty great for handling data. I used a library called Pandas, which is super handy for this kind of thing.
Working on it with Code
- Wrote Some Code: I wrote a simple Python script to read the data files and put them into a Pandas DataFrame. This is like a big table where you can easily see and work with your data.
- Cleaned it Up: Sometimes there were missing values or weird numbers that didn’t make sense. I had to clean those up so they wouldn’t mess up my analysis.
Once I had the data all nice and tidy, I started playing around with it. I made some basic plots to see how temperature and humidity changed with height. It was pretty cool to see these patterns emerge from the numbers.
Make it Visualize
- Made Some Plots: Used another Python library called Matplotlib to create graphs. I plotted temperature vs. height, humidity vs. height, and a few other things.
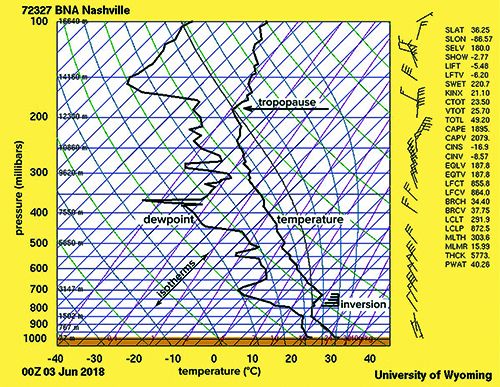
- Looked for Patterns: Tried to see if there were any interesting trends. For example, where the temperature suddenly dropped, which could indicate an inversion layer.
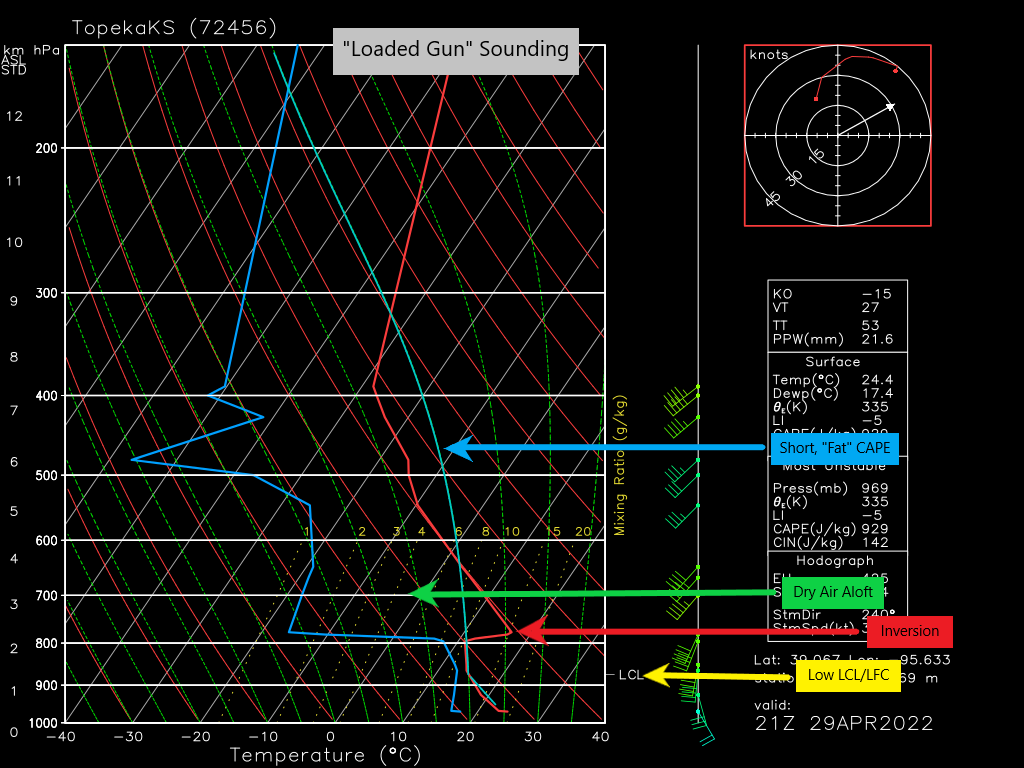
After visualizing the basic stuff, I got a bit more ambitious. I wanted to calculate something called the “CAPE” and “CIN,” which are basically measures of atmospheric instability. These can tell you if thunderstorms are likely. There are some formulas for these, and it took a bit of trial and error to get the code right.
Do the Calculations
- Calculated CAPE and CIN: Used the formulas and my data to calculate these values. It involved some integration and a bit of math, but it was satisfying to get it working.
- Interpreted the Results: Looked at the CAPE and CIN values to see if they indicated any chance of severe weather. High CAPE usually means lots of instability and a higher chance of storms.
So, that’s pretty much my journey into weather soundings. It was a fun little project, and I learned a lot about how meteorologists figure out what’s going on up in the sky. Plus, I got to play around with some cool Python tools, which is always a bonus. If you’re into weather or just like messing around with data, I definitely recommend giving it a try!